Metrics analysis provides strong insight on how your marketing initiatives are performing; however, it’s imperative to understand what you want to achieve before starting to track performance—and which tactics you’ll use to achieve them.

Why Tracking Metrics is Important
Let’s say you want to run a marathon in under four hours, but you’re currently unfamiliar with what your one-mile pace is. When you begin your training, you set a base one-mile time of twelve minutes. In order to achieve your goal of running a marathon in less than four hours, this time will need to improve. Do you think it’s important to track your progress against your goal to see if your time is improving? Of course! The same goes for your business.
Setting Your Goals
Tracking metrics is a cornerstone for a successful campaign or overarching strategy—but you must first lay the foundation with your short- and long-term goals. This could also be a good time to reevaluate your business plan, as this should help guide what your goals are.
When formulating your goals, it’s important to always use the SMART acronym:
- Specific
- Measurable
- Attainable
- Relevant
- Timely
Following the SMART pattern can help you set realistic, attainable goals within a specified timeframe.
Some possible goals to focus on could include:
- Increase brand awareness by 5 percent within six months
- Increase conversion rates by 10 percent in the first quarter
- Quicken your social media response time to customers by one minute
- Generate 150 new leads by next month
Once your goals are established, you need to identify the metrics that correlate best.
Which Metrics are Important to Track
Depending on what your business strategy is and which goals you’ve decided on, there are certain metrics that can hold more significance than others for the tactics you’re deploying.
Let’s take a look at which metrics are the most significant to track across some prominent marketing tactics.

SOCIAL MEDIA
Within social media, users aren’t just sharing and liking content; they’re also seeking out customer service. Consider tracking the following metrics if your goals align with wanting to increase brand awareness or customer support initiatives.
Comments, Retweets and Shares
92 percent of consumers believe suggestions from friends and family more than typical advertising claims, so if your content is generating ongoing conversation, you’re likely to gain the trust of more consumers. Between comments, retweets and shares, you can gain a strong sense of trust and how well your audience is engaging with your content. When a piece of content is shared or retweeted, that content is now being shown to that user’s followers—enhancing digital word-of-mouth with potential customers.
It’s important to note, though, that there can also be negative conversations surrounding a share or retweet, so always be sure to monitor these engagements and address them appropriately.
Impressions and Reach
Impressions are how many times a post shows up on someone’s timeline, and reach is the potential unique viewers a post could have. We’d recommend prioritizing reach over impressions, especially if your goal is to increase brand awareness. For example, if a user refreshed his or her timeline on Twitter and your content appears, that counts as an impression—even if the user never views the content. Only after that user views the content is it then considered reach, making reach a stronger representation of actual visibility.
If a piece of content has high reach and low engagement numbers, this can be a sign that your audience isn’t interested in that topic. This is an important performance indicator to focus on when running a content audit and forming content plans for the future.
Response Rate and Time
67 percent of customers have used social media to contact customer service. With this in mind, it’s important to pay attention to your response rate and time. 40 percent of consumers expect brands to respond within the first hour after they reach out, while 79 percent expect a response in the first 24 hours. Monitor all platforms regularly to uphold high-quality customer support.
Link Clicks
Links clicks are an effective indicator of whether users are positively acting on your content. Typically, a link will take users from a social post to a desired landing page that will give them more information about a certain topic. Clicks are an important metric to track if you’re trying to increase conversions, as landing pages typically lead to a user taking a desired action.
EMAIL MARKETING
 Goals for an email campaign could include generating more leads, converting existing leads into customers or growing a subscriber database. Let’s go through which metrics to pay attention to when analyzing an email campaign.
Click-Through Rate
Your click-through rate (CTR) is the percentage of recipients who clicked on a link in an email. Regardless of what your goal is, this is a valuable metric to track, as it can give you insight on how many people are engaging with the content within the email. The higher your CTR is, the more engaging the content within that email is. Use indicators like this to gauge what sort of content you should include in future email communications.
Open Rate
Simply put, open rate indicates how often your emails are being opened by your audience. This metric can be key in understanding how effective subject titles are within the email creative. To increase your open rate, a quick trick we suggest is to keep your email titles short and sweet—and tell your audience what to expect (while avoiding the use of all caps).
List Growth Rate
This is the rate at which your email list is growing. Naturally, your email list will deteriorate over time when users either unsubscribe or close certain email accounts—so it’s important to always work on growing your list. Try attracting new prospects to your list by crafting compelling offers, giving users more control over what content they receive and inviting users to subscribe through your social networks.

WEBSITE
Your website is generally where you want to drive your users to learn more about your brand—and ultimately convert them into a paying customer. Tracking your website’s success can relate back to several goals, including increasing traffic on specific pages, monitoring new signups on certain forms or tracking blog performance.
Below are a few metrics that can tell you how successfully your content is performing.
Conversion Rate
A conversion is when a website visitor takes a desired action—and is arguably one of the most important metrics to track. Actions could include filling out a form, signing up for email updates or even purchasing a product. Your conversion rate can be calculated by dividing your number of conversions by the number of website visitors, then multiplying that by 100. It’s important to focus on and optimize areas of your website that can help you create more conversions.
Bounce Rate
Bounce rate is the percentage of visits where users only see one page before leaving your site. For example, if a user clicks on a link that takes them to a blog post, and the blog is the only page he or she views before leaving, that’s considered a bounce.
Having a high bounce rate isn’t necessarily a negative, though. If a user is taking the action requested or gaining the information needed on a single page, that can still be considered a quality visit. It’s important to track which pages are being viewed the most by users and which actions they’re required to take on those pages.
Traffic
This represents how many sessions your website has seen over a period of time. Any time a user visits your website, it’s counted as one session—so if a user visits your website three separate times throughout the day, that would count as three sessions. It’s also important to note which pages see the most traffic and which pages have the opportunity for growth.
Average Time on Page
How long are users visiting your site? The longer people are staying on your site, the more content they’re probably digesting. Make sure you track which pages are viewed for the longest timeframes, as this can give you an idea of what content is most interesting to your target audiences.
Pages per Session
You want users to be interested in your website and explore more of what you have to offer. The more pages your prospects and customers visit, the more content they consume—which can lead to a higher chance of a conversion. Try and utilize internal links to drive users to other pages of your website to support increased pages per session.
Unique Visitors
While traffic can tell you how many sessions your website has seen, unique visitors will tell you how many different people have visited your website. You can break this down by new visitors and returning visitors. New visitors can help to grow your brand’s presence—but a viable content plan is built off returning visitors who have a continued interest in your brand.

DIGITAL ADS
Depending on what your goal is, many metrics that we’ve already discussed can relate back to digital ads including reach, site traffic and link clicks; however, there are some metrics that are unique to your digital advertising efforts and need to be accounted for when running an analysis.
Cost-Per-Click (CPC)
This is the amount of money you pay every time a user clicks on your ad. Whether it’s on Facebook, Google or other advertising platforms, CPC can used to determine whether an ad’s creative is effective—and can factor into your overall return of an ad.
Return on Advertising Spend (ROAS)
ROAS differs from return on investment (ROI) because it’s specific to a certain campaign and not your overall marketing efforts. ROAS is calculated by dividing your total campaign revenue by your total campaign cost, which helps you understand the overall efficiency of an ad campaign, as well as understand your dollar for dollar revenue. The higher your ROAS, the better.

Traditional Marketing
Traditional marketing refers to any marketing efforts that are not online, including billboards or print ads. Measuring the success of these campaigns can be a little tricky; however, there are certain methods you can use to track your results. Consider the following:
- Surveys: If you have a user’s contact information—typically an email address—you can ask how your brand was found, including traditional sources.
- Coupon codes: Generate specific codes and apply them to your offline efforts. For example, you could offer a unique promotional code within a magazine ad, then track how many people used that code. This can help form an idea of how effective that ad was for conversions.
- Unique email addresses: Create an email address unique to a certain campaign to measure how many customers are reaching out to your brand.
Regardless of what method you use, there are ways to tie the gap between traditional and digital marketing campaigns.

Setting Up a Routine
Setting up some sort of cadence for running your metrics reporting is critical for maintaining success with your day-to-day marketing, as well as throughout a campaign—but there is a distinct difference between metrics reporting and campaign reporting.
Metrics Reporting
 Metrics reports should be thought of as an overarching, long-term view of your marketing’s performance—and are different than actively tracking performance on a day-to-day basis. For example, if you plan to run organic, paid or traditional marketing over a month-long span then creating a monthly report will suffice and give a strong oversight of how those items are performing. If you were to constantly monitor these items and make frequent changes, then you could be risking the performance of the creative.
Be sure to allot at least a month in between reports for your overarching, consistent marketing tactics, including monthly organic social posts.
Campaign Reporting
 Campaign reporting differs from metrics reporting because it is more short term and involves checking the performance of a specific campaign every day or two. For example, if you’re running a Facebook advertisement over the course of ten days, then frequently checking in to monitor performance and looking for optimization opportunities is recommended. With such a short amount of time given to this advertisement, you should be trying to maximize your results within the timeframe.
It’s important to understand the value of both metrics and campaign reporting—and how you can integrate both into your strategy. They include different strategies and knowing how to separate the two can pay dividends to the success of both your long- and short-term campaigns.

Tools That Can Help
Analyzing and tracking metrics can be made easy through numerous analytics tools, including Google Analytics, as well as different insight tools natively built into social media platforms.
Let’s dive into some options you have to most effectively analyze your metrics.
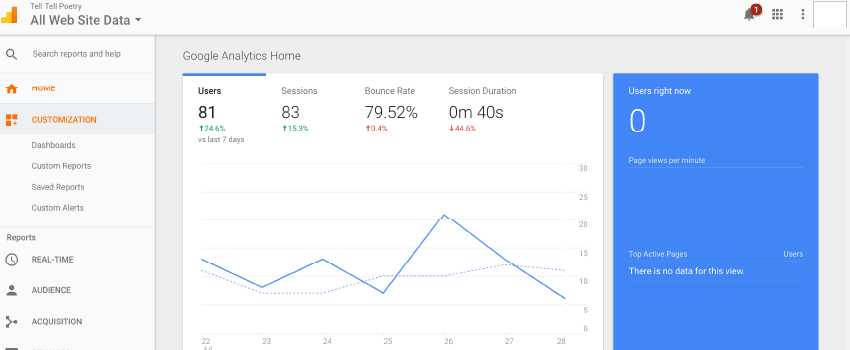
Google Analytics
Google Analytics is a powerful and free tool that can help you evaluate your website’s performance. This platform allows you to see your overall website traffic, conversion rates and audience demographics.
With an intuitive layout and customizable tools, Google Analytics allows for a more streamlined approach when gathering your website metrics. The platform also allows multiple members of your team to work together simultaneously to better build a metrics report. You can even view your website in real-time to see what users are doing and know immediately if a new blog post is the getting the attention you want it to.

Social Platform Page Insights
Many social platforms have insight tools that allow you to view metrics for that platform within its site. Let’s go over some popular platforms and how you can utilize their respective analytic tools.
- Facebook: For a business Page, Facebook offers insights such as total likes reach and Page views. To access these items, click on the Insights tab at the top of your profile Page. Facebook also offers metric reports for any ad accounts you may have.
- Instagram: To view metrics on Instagram, you must first convert your profile to a business account. It’s also worth noting that you can only see metrics on a mobile device and not on desktop. Once you’re set up, click the Insights button on your profile page where you can view items such as weekly interactions, reach and impressions on posts or Stories.
- LinkedIn: LinkedIn has a built-in metrics hub where you can track items such as unique visitors, engagement on posts and follower demographics. LinkedIn also shows metrics for other companies in your area similar to you so that you can compare metrics such as followers and engagement rate.
- Twitter: Twitter is unique in that you can view individual Tweet metrics within each Tweet. When you open your Tweet and click View Tweet Activity at the bottom, you’ll have access to total impressions and engagement levels. If you’re on desktop, you can also access Twitter Analytics by clicking the More icon on the left side of the screen, and you’ll have access to tweet metrics as a whole over a period of time.
Be sure to take advantage of these free resources to try and maximize your potential on each individual platform.

Utilizing Query Strings
A query string, also known as a UTM code, is an important tool for more holistic metrics tracking. These are small codes attached to the end of a URL that allow Google Analytics to more accurately track referral data. With query strings you can see more than just a link click—you can also see how people navigate through your website once they click.
“With query strings, you can track exactly how many page visits directly happened as a result of your social media posts or email marketing campaigns. This can help you build future campaigns and allow you to strategize and deploy content that is relevant to your audiences.”
– Kelsey Ferencz, director of web development at Concentrek
Some best practices for query strings include:
- Keep URLs clean, descriptive and easy to read
- Use underscores instead of dashes or spaces within your UTM code
- Stay consistent with lowercase text
- Track your UTM links inside a spreadsheet
Take advantage of query strings to track metrics more efficiently and measure the effectiveness of certain campaigns.

Application
Now that we’ve defined why tracking metrics is important, which metrics hold more significance than others and how to track them, you’ll need gauge your success on how close you were to achieving your goals.
If you didn’t see the results that you set out to accomplish, you’ll need to figure out which part of your marketing plan needs improved. Consider the following plans of action for optimizing your marketing efforts:
- Utilize A/B testing for your creative, including copy and imagery. Only adjust one aspect of the creative at a time, though, to help determine where specifically the adjustment was needed.
- Adjust your budget to either scale up or scale back, depending on results.
- Schedule more time for metrics analysis between marketing campaigns and implementation of new tactics to allow for enhanced optimization opportunities.
Let’s say you set a goal of wanting to increase your brand awareness by 5 percent in one year. Understanding that some of the metrics that relate the closest to this goal are reach, website traffic and social sharing, you’ll need to monitor these closely. At the end of one year, you didn’t quite see the results you had hoped. Making note of your results, you should try and evaluate each tactic individually—and determine which performed the best prior to your next campaign. For example, if organic social content wasn’t performing to the level you were hoping for, try integrating paid social advertising into your next campaign.
Remember: there are lessons to be learned from each campaign you run—and you should incorporate what you’ve learned into future campaigns.

Take the Next Step
Ready to work with a team skilled in utilizing your metrics to maximize your marketing presence? Reach out to us today!